Every big metro has a favorite kind of engineer
Before you open an engineering search in a city, find out which kind of engineer that city mostly has. It sounds like trivia. But in many big metros one discipline makes up a quarter or more of the engineers, and in Minneapolis industrial engineers are about half. Whatever you hire for, you are either inside the local main event or off to the side of it.
The reason is that the leading discipline sets the terms of a local market. If your opening is in that discipline there are plenty of candidates, but there are also plenty of other employers who want them, so your offer gets compared with a lot of other offers. If your opening is in some other discipline the pool is small. The fix might be to hire in a metro where your discipline is the one in charge.
How the count works
The counts are the employment estimates in federal occupational employment and wage data for May 2025. For every metro, add up the nine engineering occupations in that data: aerospace, biomedical, chemical, civil, electrical, electronics, industrial, mechanical and a category the government titles Engineers, All Other. Where the government withholds a count, as it does for aerospace engineers in the Atlanta metro, that count is left out. The biggest discipline’s share of the total is the metro’s specialty.
That leaves 55 metros with 5,000 or more engineers in those nine occupations. They range from the very concentrated to the almost evenly spread, and the two ends of the range tell you most of what the middle does.
Minneapolis is mostly one kind of engineer
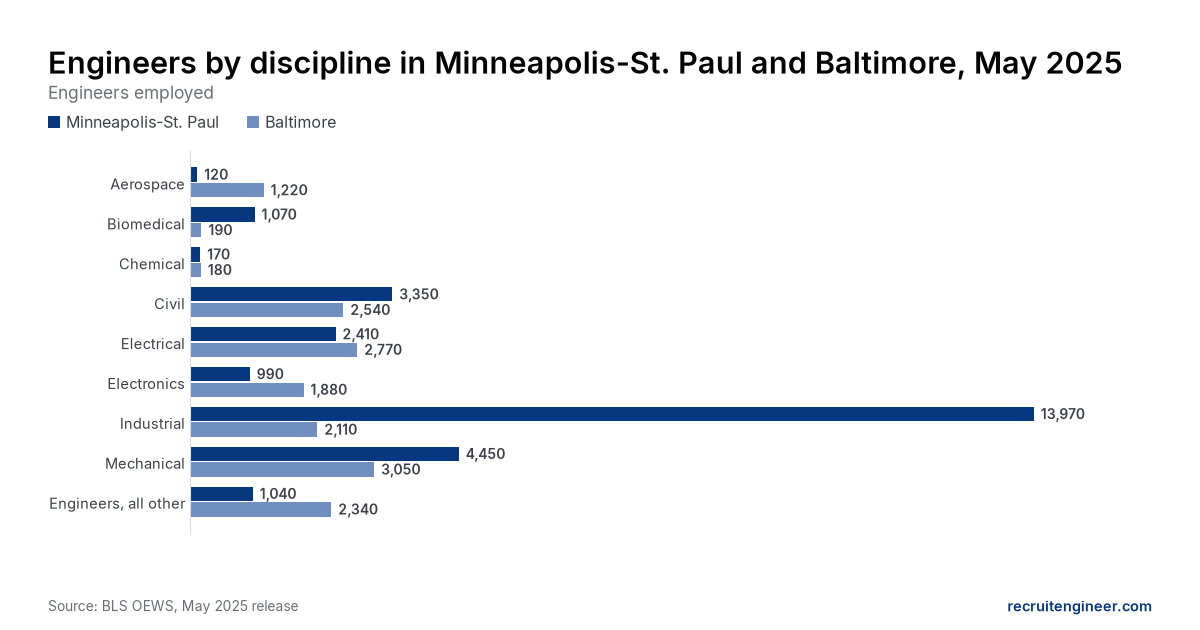
Minneapolis is the extreme case. Its roughly 14,000 industrial engineers outnumber every other kind of engineer in the metro put together, which no other metro on the list can say. Detroit is a different kind of extreme because it is big as well as concentrated. Baltimore is what a metro looks like when no discipline is really in charge.
| Discipline | Minneapolis-St. Paul | Detroit | Baltimore |
|---|---|---|---|
| Aerospace | 120 | 260 | 1,220 |
| Biomedical | 1,070 | 80 | 190 |
| Chemical | 170 | 220 | 180 |
| Civil | 3,350 | 3,870 | 2,540 |
| Electrical | 2,410 | 6,060 | 2,770 |
| Electronics | 990 | 2,310 | 1,880 |
| Industrial | 13,970 | 17,350 | 2,110 |
| Mechanical | 4,450 | 22,500 | 3,050 |
| Engineers, all other | 1,040 | 5,800 | 2,340 |
| All nine disciplines | 27,570 | 58,450 | 16,280 |
| Leading discipline’s share | 50.7% | 38.5% | 18.7% |
You might expect the dominant discipline to be paid like one, since so many employers in town want it. In Minneapolis the typical industrial engineer earns $104,700. The typical civil engineer there, in a discipline about a quarter the size, earns the same $104,700 once you round to the nearest hundred dollars. So being the main kind of engineer in town does not obviously come with a raise. It mostly comes with a lot of colleagues, which is useful in its own way because you can change employers without changing cities.
Detroit is concentrated at a much larger scale. Its roughly 22,500 mechanical engineers are the largest group of a single engineering discipline in any metro that reports the count. Its industrial engineers are the second largest such group anywhere. If you hire mechanical engineers anywhere in the country, a lot of the people who could do your job already work around Detroit, which is worth knowing before you decide relocation is out of the question.
Baltimore is the opposite. Its leading discipline is mechanical engineering, but only just, with electrical engineers close behind and several others not far off. Of the 55 metros it has the smallest leading share. If you are hiring there you are not walking into anyone’s specialty, so you are not competing with a whole local industry for the same people. You are also not getting a deep bench in any one discipline.
The rest of the map
Civil engineering is the most common leader. It tops the list in 24 of the 55 metros, including the biggest metro on each coast, which makes some sense if you think of civil engineering as the discipline every metro needs regardless of what else it does. Industrial engineering leads in 21 metros.
Mechanical engineering leads in five. Aerospace and electronics lead in two metros each. That leaves one metro, Washington, led by the category titled Engineers, All Other.
| Metro | Leading discipline | Engineers in it | All nine disciplines | Leading share |
|---|---|---|---|---|
| Minneapolis-St. Paul | Industrial | 13,970 | 27,570 | 50.7% |
| Sacramento | Civil | 5,590 | 12,020 | 46.5% |
| Urban Honolulu | Civil | 2,300 | 5,000 | 46.0% |
| Grand Rapids | Industrial | 4,170 | 9,890 | 42.2% |
| Raleigh | Civil | 4,640 | 11,500 | 40.3% |
| Miami | Civil | 6,850 | 17,180 | 39.9% |
| Tampa | Civil | 4,190 | 10,710 | 39.1% |
| Milwaukee | Industrial | 3,940 | 10,220 | 38.6% |
| Detroit | Mechanical | 22,500 | 58,450 | 38.5% |
| Greenville, SC | Industrial | 2,670 | 7,080 | 37.7% |
| Riverside | Civil | 3,510 | 9,730 | 36.1% |
| Louisville | Industrial | 2,000 | 5,650 | 35.4% |
| Cincinnati | Industrial | 5,430 | 15,390 | 35.3% |
| Chicago | Industrial | 12,750 | 36,540 | 34.9% |
| Denver | Civil | 9,130 | 26,280 | 34.7% |
| Cleveland | Industrial | 3,910 | 11,310 | 34.6% |
| San Francisco | Civil | 10,990 | 32,710 | 33.6% |
| Kansas City | Mechanical | 4,330 | 13,180 | 32.9% |
| New York | Civil | 15,590 | 47,720 | 32.7% |
| Pittsburgh | Civil | 4,210 | 12,920 | 32.6% |
| Rochester, NY | Industrial | 1,920 | 5,920 | 32.4% |
| Orlando | Civil | 3,720 | 11,820 | 31.5% |
| Columbus, OH | Industrial | 3,710 | 12,010 | 30.9% |
| Huntsville | Aerospace | 4,880 | 16,110 | 30.3% |
| Charlotte | Civil | 3,730 | 12,370 | 30.2% |
| Jacksonville | Civil | 1,900 | 6,350 | 29.9% |
| Indianapolis | Industrial | 2,900 | 9,780 | 29.7% |
| Hartford | Industrial | 2,830 | 9,620 | 29.4% |
| Salt Lake City | Industrial | 2,910 | 9,900 | 29.4% |
| Portland, OR | Industrial | 5,230 | 17,850 | 29.3% |
| St. Louis | Civil | 3,150 | 10,930 | 28.8% |
| Atlanta | Civil | 6,270 | 22,430 | 28.0% |
| Houston | Civil | 12,140 | 43,630 | 27.8% |
| Austin | Civil | 4,940 | 17,930 | 27.6% |
| San Antonio | Civil | 2,230 | 8,080 | 27.6% |
| Nashville | Civil | 2,090 | 7,590 | 27.5% |
| Albany, NY | Industrial | 1,570 | 5,700 | 27.5% |
| Phoenix | Industrial | 5,810 | 22,220 | 26.1% |
| Dallas-Fort Worth | Industrial | 10,680 | 41,230 | 25.9% |
| Washington, DC | Engineers, all other | 9,230 | 35,760 | 25.8% |
| Tucson | Aerospace | 1,720 | 6,680 | 25.7% |
| Charleston, SC | Civil | 1,310 | 5,150 | 25.4% |
| Los Angeles | Civil | 16,340 | 64,390 | 25.4% |
| Philadelphia | Industrial | 6,170 | 24,900 | 24.8% |
| Seattle | Civil | 7,680 | 31,830 | 24.1% |
| San Diego | Civil | 5,620 | 23,740 | 23.7% |
| Providence | Mechanical | 1,750 | 7,410 | 23.6% |
| Virginia Beach | Mechanical | 2,210 | 9,570 | 23.1% |
| Boston | Industrial | 9,010 | 41,760 | 21.6% |
| Palm Bay-Melbourne | Industrial | 2,030 | 9,450 | 21.5% |
| Oklahoma City | Electronics | 1,140 | 5,660 | 20.1% |
| Ogden | Civil | 1,150 | 5,740 | 20.0% |
| Dayton | Industrial | 1,720 | 8,590 | 20.0% |
| San Jose | Electronics | 5,970 | 30,480 | 19.6% |
| Baltimore | Mechanical | 3,050 | 16,280 | 18.7% |
Sacramento and Honolulu are civil engineering towns
After Minneapolis the most concentrated metros are Sacramento and Honolulu, where civil engineers are close to half of all the engineers counted. Seattle, which you might think of as an aerospace town, is led by civil engineers too, though with a much smaller share. If you are hiring civil engineers in Sacramento, you are hiring in the discipline that makes up nearly half of the local engineering workforce.
Huntsville is the aerospace one
Huntsville is the only metro on the list besides Tucson where aerospace engineers lead, with about 4,900 of them. The share is what makes Huntsville unusual, more than the headcount. If your search is for aerospace engineers in Huntsville, you are recruiting inside a market organized around your discipline, which is the best case for finding people and the hardest case for standing out to them.
Washington is led by everything else
The Washington metro is the one place on the list whose most common engineering occupation is the one the government titles Engineers, All Other. There are about 9,200 of them, the most of any metro in that category. It is a slightly funny specialty for a metro to have, a little like a bookstore whose best-selling section is the one labeled miscellaneous. If you are hiring for an engineering role that does not fit any of the named occupations, though, Washington is where the most people in that category already work.
San Jose sits near Baltimore at the evenly spread end. Electronics engineers lead there with a share under a fifth, and Oklahoma City is the only other metro where electronics engineers come out on top.
What to do with it
If you are hiring in a metro’s leading discipline, expect a long list of candidates and a crowd of employers who want the same people. Local pay figures will be well populated, which helps. Your offer then needs to hold up against those local figures rather than national averages. If you are hiring industrial engineers in Minneapolis or mechanical engineers in Detroit, that is your situation.
If you are hiring outside the leading discipline the list will be shorter. The useful move then is to look at where your discipline leads. A mechanical engineering search in a civil engineering town might do better recruiting out of Detroit or Kansas City. An aerospace search has Huntsville. A chemical engineering search in Minneapolis is a search among about 170 people, so you might at least try relocating someone.
If you are an engineer, the same logic runs the other way. Working in your metro’s leading discipline means a lot of employers within driving distance, so you can change jobs without moving. Working outside it means fewer employers but also fewer people competing with you for them, which can be leverage if you are good at the work and a problem if you want options.
The share tells you what a metro’s engineering market looks like now. Whether the industries that hire your discipline are adding jobs in that metro is a separate question, and the engineering industry growth figures by metro are where to check it before you commit to a city.